GBP/USD Forecast for September 14, 2026: Institutional Order Flow Ahead of Super Thursday
Welcome to today's daily market breakdown provided by the trading desk at TebotechSignals. The macroeconomic landscape is shifting rapidly as we head into one of the most critical weeks of Q3 2026. Currently trading near 1.3482, the GBP/USD pair has experienced aggressive bearish order flow during the London session, down roughly 0.33% on the day. A stronger US Dollar, bolstered by a surge in oil prices and safe-haven flows amid Middle East tensions, is pressuring the Cable. All eyes are now on the pivotal 1.3470–1.3480 support confluence as we transition into the New York session.
With both the Federal Reserve and the Bank of England set to announce highly anticipated interest rate decisions later this week, smart money is clearly positioning itself. For retail traders, jumping in blindly ahead of these data prints is a surefire way to become liquidity. Let's dive into the charts using Smart Money Concepts (SMC) and ICT methodology to decode institutional footprints and map out high-probability trading scenarios.
HTF Bias & Market Structure
To understand where price is going, we must frame our analysis within the Higher Time Frame (HTF) context.
* Daily Timeframe: The broader macro trend remains bullish following the aggressive rally seen in July and August. However, the recent rejection at the 1.3568 high last week has initiated a complex pullback phase. We are currently seeing a retracement into a daily bullish discount array.
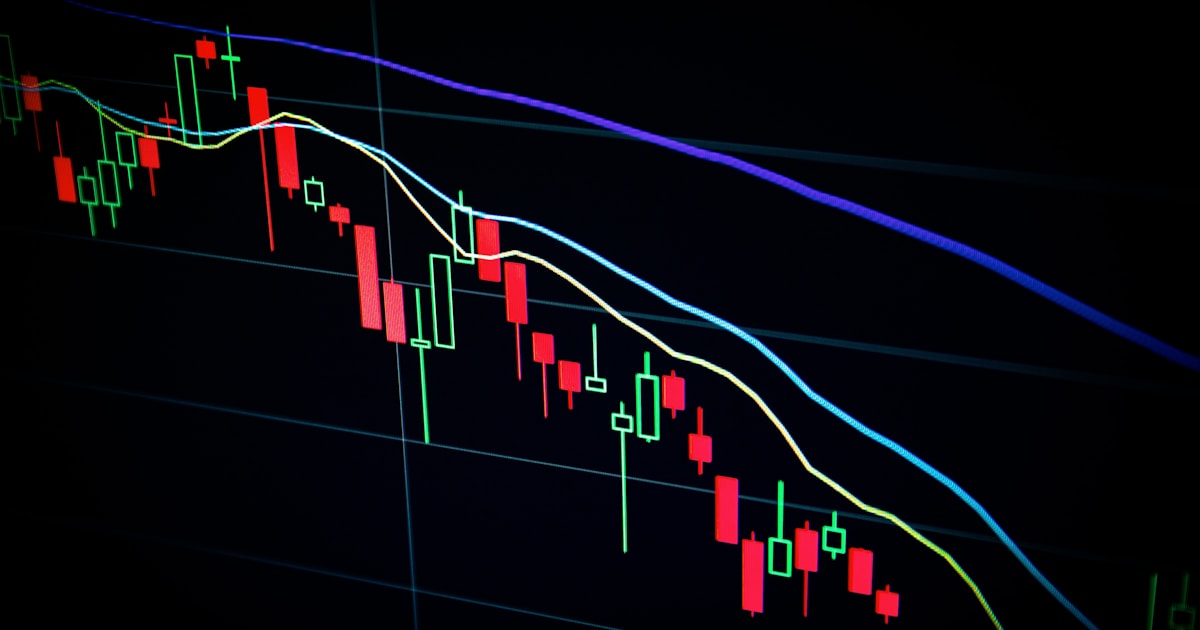
* 4-Hour Timeframe: The 4H chart has printed a localized Change of Character (CHoCH) to the downside. The failure to break the 1.3568 high resulted in a bearish double top, signaling that institutions were distributing long positions. Price is currently making lower highs and lower lows on the intraday charts, indicating that the near-term momentum is firmly controlled by the bears.
The overarching theme right now is time and price. The market is compressing and driving toward discount levels to accumulate long positions, or potentially engineering liquidity ahead of Wednesday's FOMC volatility.
Key Levels to Watch (SMC / ICT Zones)
Institutional algorithms do not trade randomly; they target specific liquidity pools and imbalances. Here are the active Points of Interest (POIs) for the upcoming sessions:
Resistance / Supply Zones (Bearish POIs)
* 1.3522 - 1.3533 (4H Bearish Order Block & FVG): This is the primary near-term supply zone. It aligns with the 200-period Simple Moving Average and a prominent Fair Value Gap left behind during last week's impulsive sell-off. Any retracement into this zone without a catalyst is likely to be met with aggressive institutional selling.
* 1.3568 - 1.3580 (Buy-Side Liquidity - BSL): The recent swing highs where early short sellers have their stop losses resting. A sweep of this level would be a classic "Turtle Soup" setup if followed by immediate displacement lower.
Support / Demand Zones (Bullish POIs)
* 1.3470 - 1.3480 (Daily Bullish Order Block & 100-EMA): Price is currently probing this exact zone. It represents the 50% Fibonacci retracement of the recent macro leg up. If this level fails to hold, the floor opens up completely.
* 1.3420 (Sell-Side Liquidity - SSL): If the 1.3470 level fractures, 1.3420 is the next major draw on liquidity. This level sits below relatively equal lows and represents a deep discount (61.8% Fib) where larger timeframe buyers may step back in.
Bullish Scenario
For a valid long setup today, we need to see evidence of institutional accumulation, not just a blind touch of a support line.
The Play: Watch for a New York session "Judas Swing" that spikes below the 1.3470 level, grabbing the Sell-Side Liquidity (SSL) resting below Friday's lows. Once the liquidity is purged, we need to see an aggressive 15-minute Market Structure Break (MSB) to the upside, leaving behind a fresh bullish Fair Value Gap (FVG).
* Entry Trigger: Retracement into the newly formed 15m bullish FVG or Order Block.
* Invalidation: A 1H candle body close below 1.3450.
* Targets: First target at the 1.3500 psychological level, with a final target at the 1.3522 bearish Order Block.
Bearish Scenario
Given the heavy intraday price action and the strong US Dollar, the bearish scenario currently holds structural weight.
The Play: If the current 1.3470 demand zone fails to produce a meaningful bounce, watch for a heavy displacement candle that breaks and closes below 1.3465 on the 1-hour chart. This will convert the current support zone into a bearish Breaker Block.
* Entry Trigger: Wait for the breakdown, then enter on the subsequent low-volume pullback into the 1.3470 Breaker Block / hidden FVG.
* Invalidation: A break back above 1.3500.
* Targets: The algorithm's primary draw on liquidity will be the deep discount zone at 1.3420.
Economic Calendar This Week
This week is a potential minefield for unprotected capital. Volatility will be extreme. Ensure you are completely flat or heavily hedged going into these high-impact data releases:
* Wednesday, Sept 16:
* UK CPI (Inflation): Early London session. Will dictate if the BoE needs to stay hawkish.
* US Federal Reserve Interest Rate Decision: NY afternoon. Markets are currently pricing in a high probability of a 25 bps hike following hotter-than-expected inflation data last week. The subsequent press conference will dictate the USD's directional bias for the rest of Q3.
* Thursday, Sept 17:
* Bank of England (BoE) Monetary Policy Summary: London session. Split votes are expected, making the forward guidance highly unpredictable.
*(To learn more about how we navigate high-impact news days, check out our guide on understanding liquidity sweeps and how to trade FVGs during volatile sessions.)*
Frequently Asked Questions (FAQ)
Why is the GBP/USD dropping today even without UK news?
The current bearish pressure is almost entirely driven by the US Dollar side of the equation. Escalating geopolitical tensions in the Middle East have caused a spike in oil prices, leading to safe-haven flows into the US Dollar. Furthermore, markets are front-running the expected hawkish tone from the Federal Reserve this coming Wednesday.
What is the best session to trade GBP/USD?
Using ICT concepts, the highest probability setups for Cable typically form during the London Open kill zone (02:00 - 05:00 EST) and the New York Open kill zone (07:00 - 10:00 EST). These windows are when institutional volume enters the market to execute liquidity sweeps and establish the daily range.
Risk Disclaimer
*Forex trading carries a high level of risk and may not be suitable for all investors. The high degree of leverage can work against you as well as for you. Before deciding to trade foreign exchange, you should carefully consider your investment objectives, level of experience, and risk appetite. The analysis provided in this article represents the opinions of TebotechSignals analysts and does not constitute financial advice. Past performance is not indicative of future results. Always use strict risk management and never risk more than 1-2% of your account equity on a single trade.*
Ready to Trade Like the Institutions?
Stop guessing and start trading with precision. If you want to see exactly how our analysts are playing these key levels in real-time, join the TebotechSignals community.
Check out our verified TebotechSignals Performance or gain access to our daily market updates and premium institutional setups by exploring our Premium Signals.
Not ready to commit? Get a taste of our analysis completely free by joining our community for Free Telegram Signals today. Trade smart, trade safe.