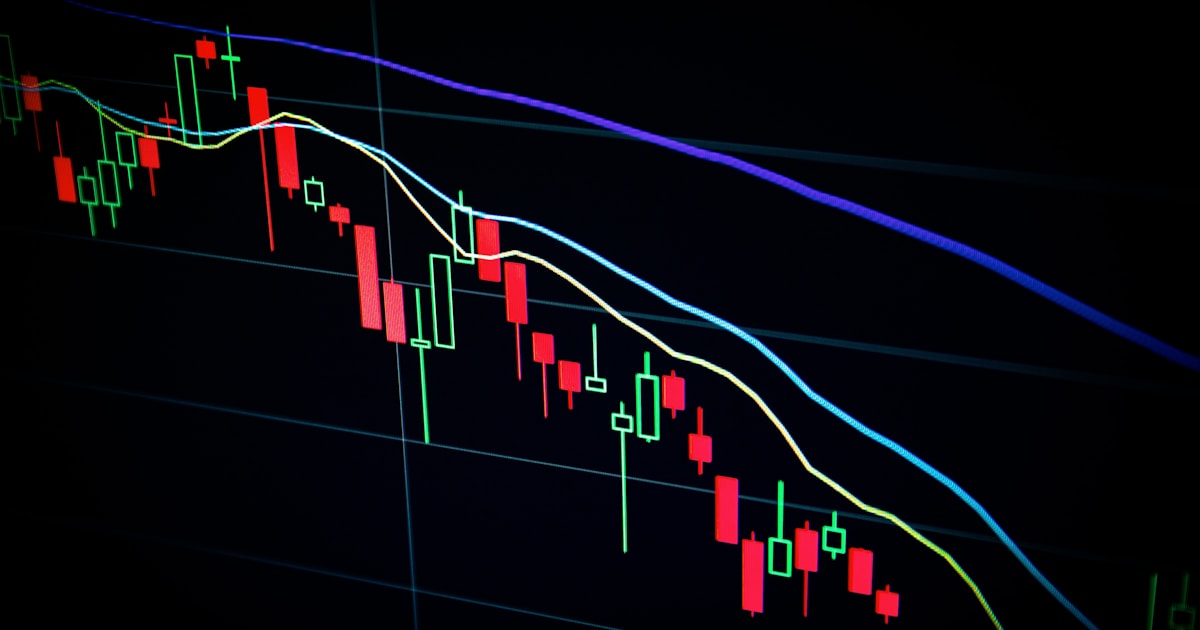
ICT trading is a method of reading price charts through the lens of institutional order flow rather than classic indicators. It was developed by a trader who goes by the handle Inner Circle Trader (ICT), and it centers on concepts like liquidity, market structure, fair value gaps and order blocks. In plain terms, ICT tries to answer one question: where is the "smart money" likely entering and exiting, and can we position alongside it with tight, defined risk?
I'll walk through this the way I'd explain it to a friend who just heard the term and wants the real picture, not the hype you see on social media.
What does ICT stand for and where did the concepts come from?
ICT stands for Inner Circle Trader, the name used by the trader who popularized this approach through years of free and paid educational content. The core idea borrows from how banks and large funds likely need to fill big orders without moving price against themselves, which creates recognizable footprints on a chart — sweeps of old highs/lows, gaps left behind by fast moves, and specific times of day when volume concentrates.
Over time, the ICT framework grew into what most people now call Smart Money Concepts (SMC). You'll see ICT and SMC used almost interchangeably, though ICT specifically refers to the original terminology and models. If you want a full reference of the terms, the SMC glossary is a useful place to check definitions as you go.
What are the core building blocks of the method?
The method rests on a handful of repeating ideas: liquidity, structure, and imbalance. Everything else — kill zones, order blocks, breaker blocks — is really a variation on where and when those three things show up.
Here's a simple breakdown:
| Concept | What it means | Why traders use it |
|---|---|---|
| Liquidity | Clusters of stop orders above/below old highs and lows | Price often moves toward these pools before reversing |
| Market structure | The sequence of higher highs/lows or lower highs/lows | Confirms trend direction or a potential shift |
| Fair Value Gap (FVG) | A price imbalance left by a fast, one-sided move | Often acts as a magnet or support/resistance zone |
| Order block | The last candle before a strong directional move | Treated as a zone where institutions may have entered |
| Kill zones | Specific time windows (London open, New York open) | Higher probability of volatility and setups forming |
A liquidity sweep is usually the trigger ICT traders wait for — price pokes above or below an obvious level, grabs the stops sitting there, and then reverses. The fair value gap is then used to time an entry back in the direction of that reversal.
How do ICT traders actually build and enter a trade?
In practice, a trade idea is built step by step rather than appearing out of nowhere. Most ICT-style setups follow a similar sequence.
- Identify the higher time frame bias — is price in a bullish or bearish structure on the daily or 4-hour chart?
- Mark obvious liquidity — recent swing highs/lows, Asian session range, or prior day's high/low.
- Wait for a sweep of that liquidity during a kill zone, such as the London or New York open.
- Look for a shift in structure on a lower time frame (for example, 5-minute or 15-minute chart) confirming the move has turned.
- Find the order block or fair value gap left by that reversal move to use as an entry zone.
- Place the stop loss beyond the liquidity sweep, and set a target at the next meaningful liquidity pool or structural level.
Example: Say gold (XAU/USD) sweeps a prior day's low at 2,015, then sharply reverses and breaks structure back above 2,020. A trader marks the fair value gap left on that move — say 2,017 to 2,019 — and looks to enter a long on a pullback into that zone, with a stop below the sweep low and a target near the next resistance around 2,030. This is a simplified illustration, not a signal, and real markets rarely line up this cleanly.
Displacement is the word ICT traders use for that sharp, one-sided move that confirms real intent rather than random noise — it's worth understanding the difference, which is covered in this breakdown of displacement.
How is this different from regular technical analysis?
The main difference is what the trader is reading. Classic technical analysis leans on indicators — moving averages, RSI, MACD — applied to price history. ICT trading leans on price action itself: where stops likely sit, where imbalances were left behind, and when volume tends to spike.
Neither approach provides certainty, and both require a trader to define risk before entering; trading carries a high risk of loss. What ICT concepts add is a framework for explaining why price moved where it did, which some traders find more intuitive than reading a lagging indicator. If you want to compare specific structures within the method, mitigation blocks versus breaker blocks is a good next read once the basics click.
Does the ICT method actually work, and what's the risk?
No method works all the time, and nobody should present ICT concepts as a shortcut to consistent profits. Trading forex and gold carries a high risk of loss, and that's true whether you're using ICT concepts, classic technical analysis, or any other approach.
What matters more than the framework is what you do with losing trades. Capping risk at a small, fixed percentage per trade — many traders use something around 0.5% — means a string of losses doesn't do lasting damage to the account while you're still learning to read these setups reliably. Combining price-based concepts with context from institutional positioning data, such as weekly CFTC Commitment of Traders reports, can add a longer-term lens on who's actually net long or short, rather than relying on price action alone.
How should a beginner actually start learning this?
Start slow, on a demo account, and focus on one or two concepts at a time rather than trying to memorize every term at once. Liquidity sweeps and fair value gaps are usually the easiest entry point.
A structured path helps more than jumping between random videos. A full step-by-step ICT playbook for beginners lays out a logical order to learn the concepts in, and our broader education section covers related topics like candlestick reading. Speaking of which, understanding raw candlestick patterns first makes the ICT-specific terminology click faster, since most ICT models are really just named candlestick behaviors around key levels.
For traders in Nigeria, South Africa, Ghana and Kenya, a practical note: London and New York kill zones fall later in your local evening, so many traders in these time zones focus instead on the London session overlap with their afternoon, or review setups from the New York close the next morning before the market resets. Watching how your local clock lines up with London and New York open times before committing to a kill zone strategy will save a lot of confusion.
If you'd rather watch how these concepts play out in real time before trading live, our free signals page shows how setups are framed using this kind of structure, without any cost to follow along.
Frequently asked questions
Is ICT trading suitable for beginners?
It can be learned by beginners, but it has a real learning curve — start with one or two concepts like liquidity and fair value gaps rather than every ICT term at once.
Do I need expensive courses to learn ICT concepts?
No, a large amount of free material exists, including structured guides and glossaries; the key is consistency in practicing on a demo account, not the price of the course.
Is ICT trading inherently profitable? Trading involves a high degree of risk and potential for loss; past results do not guarantee future performance.
No method guarantees profits, and trading forex and gold carries a high risk of loss regardless of the strategy used, so risk management matters as much as the entry technique.