GBP/USD Forecast 2026-09-16: CPI Data & Pre-FOMC Consolidation

Welcome to today's GBP/USD market analysis from TebotechSignals. As we navigate the London and New York sessions on September 16, 2026, the GBP/USD pair is currently trading around the 1.3480 to 1.3518 region. The market is digesting the recent UK Consumer Price Index (CPI) data, which met expectations, while producer prices (PPI) came in hotter than anticipated. The pair is currently consolidating in a tight range as traders await the highly anticipated Federal Reserve (FOMC) interest rate decision.

HTF Bias & Market Structure

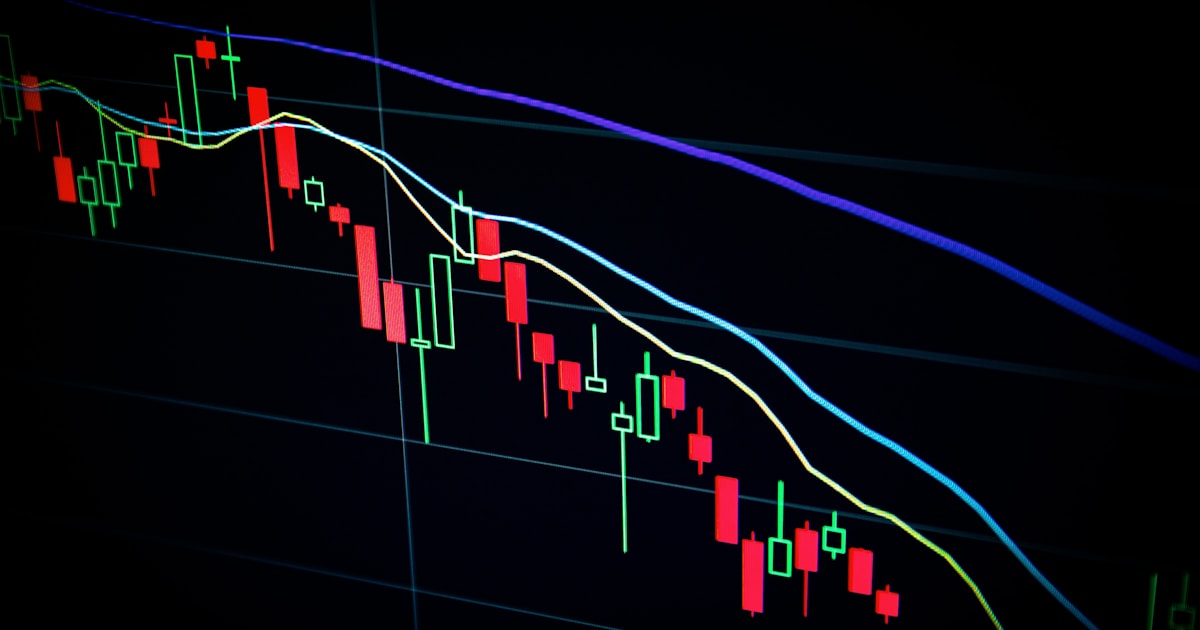
From a Higher Time Frame (HTF) perspective, the GBP/USD has been trapped in a broad consolidation phase. Recent price action on the daily chart shows the pair hovering just above the 100-day moving average, with the Relative Strength Index (RSI) sitting around 42, indicating fading bullish momentum. Applying Smart Money Concepts (SMC), the market structure on the 4H chart has shifted from bullish to bearish, creating a series of lower highs and lower lows. The institutional bias leans slightly bearish in the near term, as smart money accumulates short positions ahead of the FOMC event.

Key Levels to Watch

To navigate today's sessions, we must identify the key liquidity pools, Fair Value Gaps (FVG), and Order Blocks (OB):

* Resistance / Supply Zones:

* 1.3570: A major daily order block and the recent bullish breakout cap. This level contains significant buy-side liquidity (BSL).

* 1.3527: The previous daily close and a minor 1H bearish FVG.

* Support / Demand Zones:

* 1.3480: Current session low and immediate support.

* 1.3200: A major HTF support floor and bullish order block. This is a critical level for long-term buyers.

Bullish Scenario

For a bullish continuation, we need to see a displacement above the 1.3527 level during the New York session, filling the immediate FVG. If price can reclaim this area, the next target for smart money will be the buy-side liquidity resting above the 1.3570 order block. A dovish surprise from the FOMC dot plot could provide the necessary catalyst for this upward expansion.

Bearish Scenario

Given the current bearish market structure on the intraday charts, a rejection at the 1.3500-1.3527 supply zone could lead to a sell-off. If the price breaks below the 1.3480 support, we expect a run on sell-side liquidity (SSL) towards the 1.3300 psychological level, and potentially down to the major 1.3200 support floor. A hawkish Fed stance will likely fuel this downward move.

Economic Calendar This Week

This week is packed with high-impact, three-star events that will inject volatility into the markets:

* UK CPI & PPI: Released earlier today, showing mixed inflationary pressures.

* FOMC Interest Rate Decision & Dot Plot: The main event of the week. Markets have heavily priced in a rate hike, so the focus will be on the Fed's forward guidance.

* Bank of England (BoE) Decision: Following the Fed, the BoE will also announce its policy, adding further turbulence to the Cable.

FAQ

What is the current trend for GBP/USD?

While the long-term trend has seen the pair reach six-month highs recently, the short-term intraday trend has shifted to bearish as the market consolidates ahead of major central bank decisions.

How does the FOMC decision affect GBP/USD?

The FOMC decision heavily impacts the US Dollar side of the pair. A hawkish Fed (raising rates or projecting more hikes) typically strengthens the USD, pushing GBP/USD lower. Conversely, a dovish Fed weakens the USD, pushing the pair higher.

Risk Disclaimer

*Trading foreign exchange on margin carries a high level of risk and may not be suitable for all investors. The high degree of leverage can work against you as well as for you. Before deciding to trade foreign exchange, you should carefully consider your investment objectives, level of experience, and risk appetite. The possibility exists that you could sustain a loss of some or all of your initial investment. TebotechSignals provides this analysis for educational purposes only and does not guarantee any specific outcomes.*

Join TebotechSignals

Ready to elevate your trading with precision SMC/ICT setups? Check out our premium signals and view our past performance. If you want to test the waters first, join our community and get access to our free signals today. For more educational content, read our related blog posts.

Related reading

Blog | Tebotechsignals
Skip to main content
market commentary
September 16, 2026

TebotechSignals Research Team

Institutional FX Analysts · ICT Smart Money Concepts Specialists

GBP/USD Forecast 2026-09-16: CPI Data & Pre-FOMC Consolidation

GBP/USD forecast for Sept 16, 2026. Analyzing SMC levels, key order blocks, and liquidity zones around 1.3500 ahead of the FOMC rate decision.

#gbp-usd
#daily-forecast
#smc
#price-forecast
#2026-09-16

📘 Reading Price Like the Big Players

Liquidity, order blocks and market structure — explained in plain English. Just $10.00.

Get It

📘 Trading Without the Drama

Fixing risk management, discipline and misinformation — explained in plain English. Just $10.00.

Get It
✨
Sponsored · Keller, TX

Turn Your Profits Into Memories 🎉

GBP/USD Forecast 2026-09-16: CPI Data & Pre-FOMC Consolidation

Welcome to today's GBP/USD market analysis from TebotechSignals. As we navigate the London and New York sessions on September 16, 2026, the GBP/USD pair is currently trading around the 1.3480 to 1.3518 region. The market is digesting the recent UK Consumer Price Index (CPI) data, which met expectations, while producer prices (PPI) came in hotter than anticipated. The pair is currently consolidating in a tight range as traders await the highly anticipated Federal Reserve (FOMC) interest rate decision.

HTF Bias & Market Structure

From a Higher Time Frame (HTF) perspective, the GBP/USD has been trapped in a broad consolidation phase. Recent price action on the daily chart shows the pair hovering just above the 100-day moving average, with the Relative Strength Index (RSI) sitting around 42, indicating fading bullish momentum. Applying Smart Money Concepts (SMC), the market structure on the 4H chart has shifted from bullish to bearish, creating a series of lower highs and lower lows. The institutional bias leans slightly bearish in the near term, as smart money accumulates short positions ahead of the FOMC event.

Key Levels to Watch

To navigate today's sessions, we must identify the key liquidity pools, Fair Value Gaps (FVG), and Order Blocks (OB):

  • Resistance / Supply Zones:
    • 1.3570: A major daily order block and the recent bullish breakout cap. This level contains significant buy-side liquidity (BSL).
    • 1.3527: The previous daily close and a minor 1H bearish FVG.
  • Support / Demand Zones:
    • 1.3480: Current session low and immediate support.
    • 1.3200: A major HTF support floor and bullish order block. This is a critical level for long-term buyers.

Bullish Scenario

For a bullish continuation, we need to see a displacement above the 1.3527 level during the New York session, filling the immediate FVG. If price can reclaim this area, the next target for smart money will be the buy-side liquidity resting above the 1.3570 order block. A dovish surprise from the FOMC dot plot could provide the necessary catalyst for this upward expansion.

Bearish Scenario

Given the current bearish market structure on the intraday charts, a rejection at the 1.3500-1.3527 supply zone could lead to a sell-off. If the price breaks below the 1.3480 support, we expect a run on sell-side liquidity (SSL) towards the 1.3300 psychological level, and potentially down to the major 1.3200 support floor. A hawkish Fed stance will likely fuel this downward move.

Economic Calendar This Week

This week is packed with high-impact, three-star events that will inject volatility into the markets:

  • UK CPI & PPI: Released earlier today, showing mixed inflationary pressures.
  • FOMC Interest Rate Decision & Dot Plot: The main event of the week. Markets have heavily priced in a rate hike, so the focus will be on the Fed's forward guidance.
  • Bank of England (BoE) Decision: Following the Fed, the BoE will also announce its policy, adding further turbulence to the Cable.

FAQ

What is the current trend for GBP/USD? While the long-term trend has seen the pair reach six-month highs recently, the short-term intraday trend has shifted to bearish as the market consolidates ahead of major central bank decisions.

How does the FOMC decision affect GBP/USD? The FOMC decision heavily impacts the US Dollar side of the pair. A hawkish Fed (raising rates or projecting more hikes) typically strengthens the USD, pushing GBP/USD lower. Conversely, a dovish Fed weakens the USD, pushing the pair higher.

Risk Disclaimer

Trading foreign exchange on margin carries a high level of risk and may not be suitable for all investors. The high degree of leverage can work against you as well as for you. Before deciding to trade foreign exchange, you should carefully consider your investment objectives, level of experience, and risk appetite. The possibility exists that you could sustain a loss of some or all of your initial investment. TebotechSignals provides this analysis for educational purposes only and does not guarantee any specific outcomes.

Join TebotechSignals

Ready to elevate your trading with precision SMC/ICT setups? Check out our premium signals and view our past performance. If you want to test the waters first, join our community and get access to our free signals today. For more educational content, read our related blog posts.
Share with a trader who needs this

✨
Sponsored · Keller, TX

Turn Your Profits Into Memories 🎉

📲 Get Free Daily Signals on WhatsApp

Follow our free channel for daily market briefs, ICT signals, and SMC education — delivered straight to your WhatsApp.

Join Free →

Disclaimer: This site is an educational platform. All content — including courses, articles, and any market commentary — is for educational and informational purposes only and does not constitute financial, investment, or professional advice, a recommendation, or a solicitation to trade. It is general in nature and does not take into account your individual financial situation, objectives, or needs. All trading and investing involve risk of loss; past performance is not indicative of future results. Always conduct your own research and consult a licensed professional before making any financial decisions. Client and testimonial experiences may not be typical — individual results will vary. Full fee structure is disclosed on our Pricing page.

We use cookies for essential site functionality and, with your consent, for analytics and advertising (Google Analytics, Facebook, Bing) to understand traffic and improve TebotechSignals. See our Privacy Policy for details.