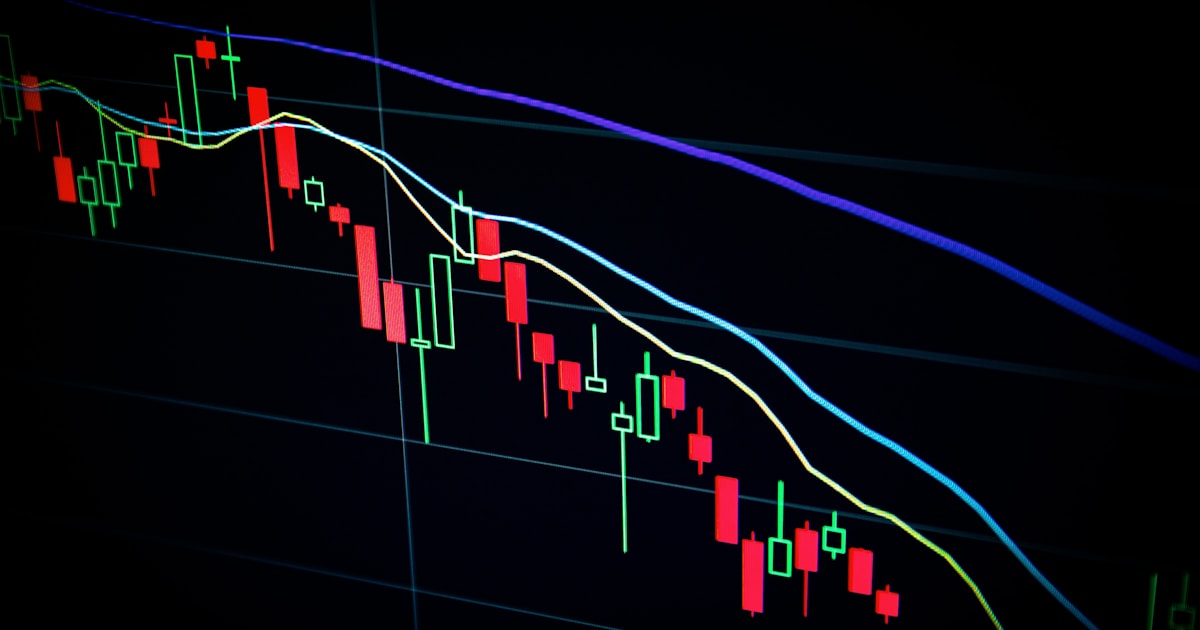
A liquidity sweep means price briefly pushes beyond a recent high or low, usually clearing out stop-loss orders resting there, before reversing in the opposite direction. The move isn't random. It happens because that price level is where a cluster of orders sits, and clearing them gives larger participants the volume they need to fill their own positions. If you've seen price wick through an obvious level and then snap back hard, you've already watched a liquidity sweep happen.
Why would anyone deliberately sweep liquidity?
Because filling large orders quietly is hard, and resting stop orders provide the opposite-side liquidity needed to do it.
When a bank or fund needs to sell a big position, they need buyers on the other side. A pool of stop-loss sell orders sitting just below a recent swing low is, functionally, buy-side liquidity waiting to be absorbed — triggering those stops means sell orders fire into the market, and whoever is on the other side can use that flow to build or exit a position without chasing price up on their own. This is one of the core ideas behind smart money concepts (SMC), and it's why price so often seems to "hunt" the obvious level before doing the opposite of what retail traders expected.
This isn't a conspiracy theory. It's simply a consequence of how order books and stop orders work in any market with concentrated liquidity.
Where do liquidity sweeps usually happen?
They cluster around price levels where traders commonly place stops: recent swing highs and lows, round numbers, and the edges of well-known ranges.
Common locations include:
- The high or low of the previous day, week, or trading session
- Equal highs or equal lows where multiple swing points line up
- Round numbers like 1.1000 on EUR/USD or 2,000 on gold
- The edges of an Asian session range before London opens
- Levels just beyond an obvious chart pattern (head and shoulders, double top, trendline)
If you want to see how this looks across live pairs, the EUR/GBP forecast covering order block targets and the XAU/USD forecast around a post-FOMC sweep both walk through real chart examples.
How do I actually spot a liquidity sweep on my own charts?
Look for a sharp wick through a known level followed by a quick reversal back inside the prior range, ideally on a lower timeframe for entry timing.
- Mark the obvious highs and lows on your chart — the ones any trader would place a stop near.
- Wait for price to push through one of those levels, even briefly.
- Check that the move doesn't hold — price should snap back inside the range fairly quickly, often within the same candle or the next one or two.
- Look for confirmation on a lower timeframe, such as a shift in short-term structure or a fair value gap left behind by the reversal.
- Only then consider an entry, with your stop placed beyond the sweep's extreme, not at the original level.
This process is covered in more depth in a practical SMC guide to identifying liquidity sweeps, and the candle-by-candle mechanics pair well with understanding candlestick patterns around these reversal points.
Is a liquidity sweep just another name for a stop hunt?
Not exactly — a stop hunt is often used loosely to mean any move that triggers stops, while a liquidity sweep specifically describes a deliberate, structured move into known liquidity followed by a reversal.
| Term | What it usually means | Implies intent? |
|---|---|---|
| Stop hunt | Casual term for any stop-triggering move | Often implied, but vague |
| Liquidity sweep | A specific SMC concept: price taps a liquidity pool then reverses | Yes, tied to market structure |
| Normal breakout | Price pushes through a level and keeps going | No reversal expected |
The distinction matters because treating every stop-triggering wick as a "sweep" will have you expecting a reversal that doesn't come. For a deeper comparison, see liquidity sweep vs stop hunt: what's the real difference.
What does a liquidity sweep trade actually look like?
It looks like waiting for the sweep to happen first, then entering in the direction of the reversal with a tight, logical stop.
Example (hypothetical, round numbers for clarity):
Say EUR/USD has an obvious swing low at 1.0850 that's held for three days. Price pushes down to 1.0838, sweeping that low and triggering stops, then closes back above 1.0850 within the hour. A trader risking 0.5% of a $10,000 account might risk $50 on this setup, placing a stop just below the sweep's low at 1.0830 and targeting the next resistance level for a reasonable reward-to-risk ratio.
The point of the example isn't the specific numbers — it's the sequence: sweep first, confirmation second, entry third, stop placed beyond the extreme of the sweep rather than at the old level everyone else was watching.
Real case studies showing this play out, including ones that didn't work, are worth studying both ways. The EUR/NZD sell case study with a liquidity sweep and fair value gap is a clean example, while the BTC/USD case study where a liquidity sweep stop failed is an honest look at how these setups can also go wrong.
A note for traders in Nigeria, South Africa, Ghana and Kenya
Liquidity sweeps around session opens and closes are tied to London and New York trading hours, not local time, so if you're trading from Lagos, Johannesburg, Accra or Nairobi, it helps to convert those session times to your own clock rather than watching your local open and close. The Asian range sweep before London opens, for instance, happens on the London clock — plan your screen time around that rather than around midnight local time if you're several hours ahead or behind.
How does this connect to institutional positioning?
Liquidity sweeps are a short-term, price-action signal, while institutional positioning data shows who's actually been building or reducing exposure over time — using both together gives more context than either alone.
A sweep tells you where stops were cleared today. CFTC Commitments of Traders data, tracked in weekly institutional positioning, tells you whether large speculators have been net long or short over recent weeks. Pairing a sweep at a key level with positioning that already favors a reversal direction can make the setup more coherent, though it's never a certainty. The Macro Compass adds yield spread and futures flow context on top of that if you want a fuller macro picture before acting on a sweep.
Trading forex and gold carries a high risk of loss, and liquidity sweeps — like any price pattern — can fail or reverse again without warning, so position sizing matters more than spotting the pattern itself.
If you're still building the foundations of smart money concepts, the education section has structured material to work through, and you can see how these ideas are applied in real time through free forex signals.
Frequently asked questions
Do liquidity sweeps happen on every pair and on gold?
Yes, the concept applies to any liquid market with resting stop orders, including major forex pairs and gold, though how cleanly they show up can vary with volatility and session timing.
Can a liquidity sweep fail to reverse?
Yes — price can sweep a level and simply continue in the same direction, which is why confirmation and proper stop placement matter more than assuming every sweep reverses.
Do I need special software to spot liquidity sweeps?
No, a standard charting platform is enough; you're mainly looking for swing highs and lows, wicks beyond them, and how quickly price comes back inside the range.