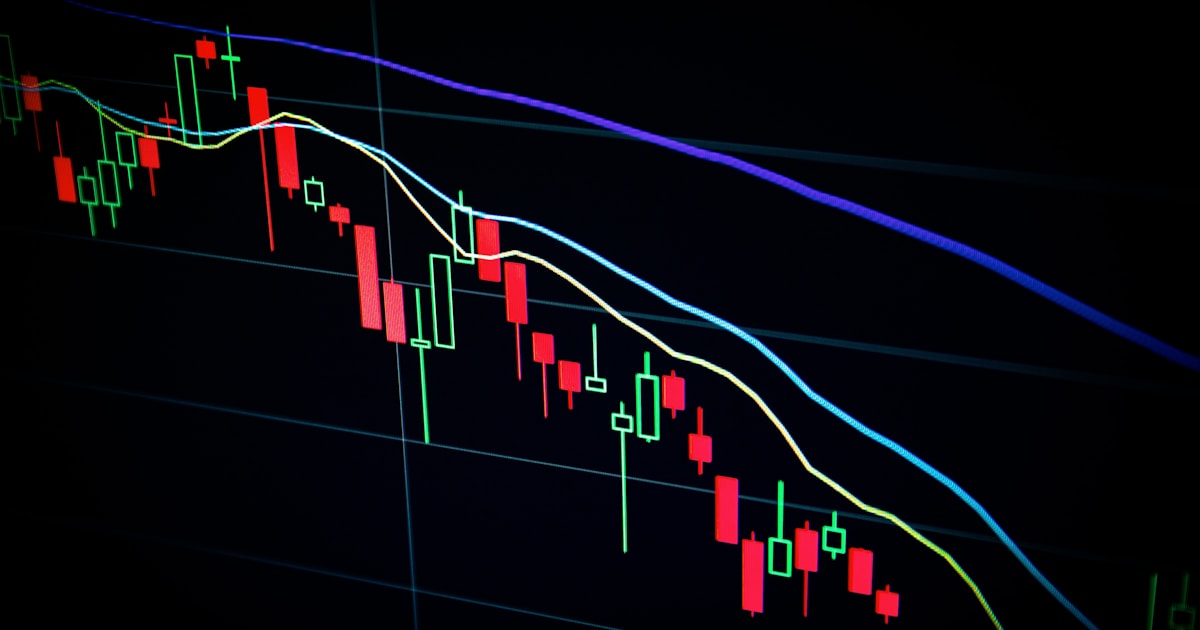
A liquidity sweep is identified by watching price push beyond an obvious high or low (equal highs, equal lows, a session high, a trendline) and then snap back through that level within a few candles, usually on a sharp wick or a quick spike-and-reverse. You confirm it's a real sweep, not a genuine breakout, when the close falls back inside the previous range and the move was driven into an area where retail stops were obviously resting.
This is one of the most asked questions on forex forums, and for good reason. Once you can see sweeps clearly, a lot of "random" price action starts to make sense. Let's go through it properly.
What does a liquidity sweep actually look like on the chart?
It looks like a wick, not a trend. Price spikes past a well-defined high or low, trades there briefly, then closes back on the other side of that level, often leaving a long wick with a small body.
Common visual signs:
- A sharp spike beyond equal highs or equal lows that quickly reverses
- A candle with a long upper or lower wick and a close near the open
- The move happens fast, often in one to three candles, not a slow grind
- Volume or momentum often fades right after the spike (you won't always have volume data on retail forex feeds, but you can see it on indices and gold futures)
- Price returns to, or through, the range it just broke out of
If you want to see this pattern dissected candle by candle, the EUR/NZD sell case study and the EUR/CAD sell case study both walk through real sweeps before the entry was taken.
Where on the chart should I actually look for sweeps?
Look at obvious levels where retail traders are likely to have placed stops: equal highs and lows, prior session highs and lows, and trendlines that have been respected more than twice.
| Liquidity type | Where it forms | Who tends to get trapped | Reliability note |
|---|---|---|---|
| Equal highs/lows | Two or more touches at nearly the same price | Breakout traders and stop-loss orders above/below the level | Very common, watch for the fastest reaction |
| Session highs/lows | Asian, London, or New York session extremes | Range traders fading the session | Useful around session opens, see below |
| Trendline liquidity | A trendline touched 3+ times | Traders using the trendline as support/resistance | Can be less reliable if the trendline is drawn loosely |
| Round numbers | Big figures like 1.1000 or 2000.00 on gold | Traders anchoring on psychological levels | Works best combined with another liquidity type |
The strongest setups usually combine two of these at once, for example equal lows sitting right on a round number.
How do I tell a real sweep from a normal breakout?
You wait for the close, not the wick. A genuine breakout usually closes beyond the level and keeps building momentum in that direction; a sweep closes back inside the range almost immediately.
A simple checklist:
- Did price break the level by a small, clean margin, or did it spike far beyond it on a single candle?
- Did the candle close back inside the previous range, or did it close beyond the level?
- Is there a lower timeframe structure shift (a break of a recent swing high/low in the opposite direction) right after the spike?
- Is there a fair value gap or imbalance left behind that price is likely to return to?
- Does the move line up with a session open, a news release, or an obvious liquidity pool, rather than happening in the middle of nowhere?
If most of these line up, you're probably looking at a sweep rather than a real breakout. If you want a deeper comparison between the two concepts, the difference between a liquidity sweep and a stop hunt is worth reading, because the terms get used loosely online and the distinction matters for how you trade it.
What's a step-by-step process to trade a sweep once I've spotted one?
The process is: mark the liquidity, wait for the sweep and the close back inside, confirm a structure shift, then enter with a tight, logical stop.
- Mark the obvious liquidity pool (equal highs/lows, session extreme, or trendline) on your chart before price gets there
- Wait for price to spike through that level
- Wait for the candle to close back inside the range, confirming rejection
- Look for a break of structure on a lower timeframe in the new direction
- Enter on a retracement into the fair value gap or order block left behind, with your stop just beyond the sweep's wick
- Size the position so that if your stop is hit, you lose no more than roughly 0.5% of your account
Example (hypothetical, for teaching only): say gold is trading around 2,000.00 and has equal lows at 1,990.00 from the last two days. Price spikes down to 1,986.00, closes back above 1,990.00 within the same four-hour candle, and then breaks a small swing high on the 15-minute chart. You enter a buy near 1,991.50 with a stop at 1,985.00 (below the sweep wick) and a target near the next resistance at 2,005.00. On a $10,000 account risking 0.5% ($50), that stop distance of 650 pips-equivalent on gold would simply tell you your position size, not your outcome — the trade can still lose.
If you want to see how this looks in a full forecast rather than a textbook example, the XAU/USD post-FOMC liquidity sweep breakdown and the EUR/USD pre-Fed liquidity sweep setup both show the same checklist applied to live charts.
Does COT positioning help me trust a sweep more?
Yes, in the sense that it tells you which side is already crowded, which makes a sweep against that crowd more believable. The CFTC's Commitment of Traders report shows how large speculators and commercial hedgers are positioned in futures markets, and when a sweep happens in the direction that aligns with where institutions are already leaning, it carries more weight than a sweep with no positioning context behind it.
This isn't a magic filter and it won't tell you the exact entry candle, but it's a useful second opinion. We publish a weekly institutional positioning breakdown that tracks this across majors and gold so you're not reading the raw CFTC data cold every Friday.
Does my time zone matter for spotting sweeps?
Yes, because sweeps cluster around session opens and closes, and traders in Lagos, Johannesburg, Accra, and Nairobi are often watching the London and New York sessions open during their afternoon and evening hours rather than their morning.
If you're trading from West or East Africa, it's worth knowing that the London open and the New York open — the two windows where liquidity sweeps happen most often — fall later in your day compared to European or North American traders, so plan your screen time around those windows rather than your local morning session.
A quick word on risk
Trading forex and gold carries a high risk of loss, and spotting a liquidity sweep correctly does not remove that risk, it only improves the context for your decision.
If you're still building this skill, it helps to practice alongside live examples rather than in isolation. The step-by-step guide to trading liquidity sweeps and our broader education section both go further into combining this with candlestick confirmation, and you can see the pattern applied in real time through our free forex signals.
Frequently asked questions
Can a liquidity sweep fail?
Yes, price can sweep a level and then simply continue in the direction of the sweep instead of reversing, which is why confirmation steps like a structure shift and a logical stop matter rather than entering on the wick alone.
Do liquidity sweeps happen on every pair and on gold the same way?
The underlying idea is the same, but gold and some lower-liquidity pairs can produce sharper, faster wicks around news events, so the same checklist applies but you may want a slightly wider stop to account for that volatility.
Is a liquidity sweep the same as a stop hunt?
They're closely related but not identical in cause; the difference between a liquidity sweep and a stop hunt explains why one is a market structure concept and the other implies deliberate intent, which is harder to prove on a chart alone.